MSTY: Inside the High-Yield Bitcoin-Adjacent ETF Strategy
In the rapidly evolving landscape of exchange-traded funds, few have captured investor attention quite like the YieldMax MSTR Option Income Strategy ETF (MSTY). With its extraordinary distribution rate exceeding 88%* and indirect exposure to Bitcoin through MicroStrategy’s stock, MSTY represents a fascinating case study in financial engineering. But beneath the allure of high monthly payouts lies a options strategy that many investors struggle to fully comprehend.

This article deconstructs MSTY’s unique approach, revealing the mechanics behind its high yield, explaining its synthetic exposure strategy, and addressing common misconceptions about its NAV dynamics. Whether you’re considering an investment in MSTY or already hold it in your portfolio, understanding these inner workings is essential for making informed decisions.
TL;DR
- MSTY creates synthetic exposure to MicroStrategy (MSTR) through a combination of long call options and short put options rather than directly owning the stock.
- The fund generates its extraordinary 88%*+ distribution rate through option premiums and Treasury income, though a significant portion is likely return of capital.
- MSTY employs two strategies: a standard covered call approach that caps upside but maximizes income, and a covered call spread strategy that allows more upside participation at the cost of lower income.
- Without reinvestment of the return of capital portion of distributions, NAV erosion occurs over time, potentially reducing both principal and future distribution amounts.
- The fund trades at either a premium or discount to NAV based on market sentiment, with most of 2024 seeing MSTY trade at a premium, indicating strong investor demand.
Understanding MSTY’s Foundation
YieldMax MSTR Option Income Strategy ETF (MSTY) launched on February 21, 2024, offering investors a novel way to gain exposure to MicroStrategy (MSTR) – a company that has transformed itself into a Bitcoin acquisition vehicle. Unlike traditional ETFs that directly purchase shares of their target companies, MSTY employs a options-based approach to provide indirect exposure to MSTR while generating substantial monthly income.
The fund’s primary objective is to deliver current income to investors, with a secondary goal of providing exposure to MSTR’s share price movements, subject to limitations on potential gains. This dual mandate creates a hybrid investment vehicle that aims to transform MSTR’s notorious volatility into a steady stream of monthly distributions.
Since its inception through March 31, 2025, MSTY has delivered remarkable performance, with NAV returns of 216.38% cumulatively (183.09% annualized) and market price returns of 206.79% cumulatively (175.32% annualized). However, these impressive figures mask a more complex reality about the fund’s distribution mechanics and performance dynamics that investors must understand.
The Synthetic Exposure Strategy
At the heart of MSTY’s strategy is its approach to gaining exposure to MSTR without actually owning any shares. This “synthetic long” position forms the backbone of the fund’s investment approach and is constructed through a balanced options strategy.
Creating a Synthetic Long Position
MSTY creates its exposure to MSTR through a combination of two options positions:
- Long call options with strike prices at or near the current MSTR price (at-the-money)
- Short put options at the same strike price
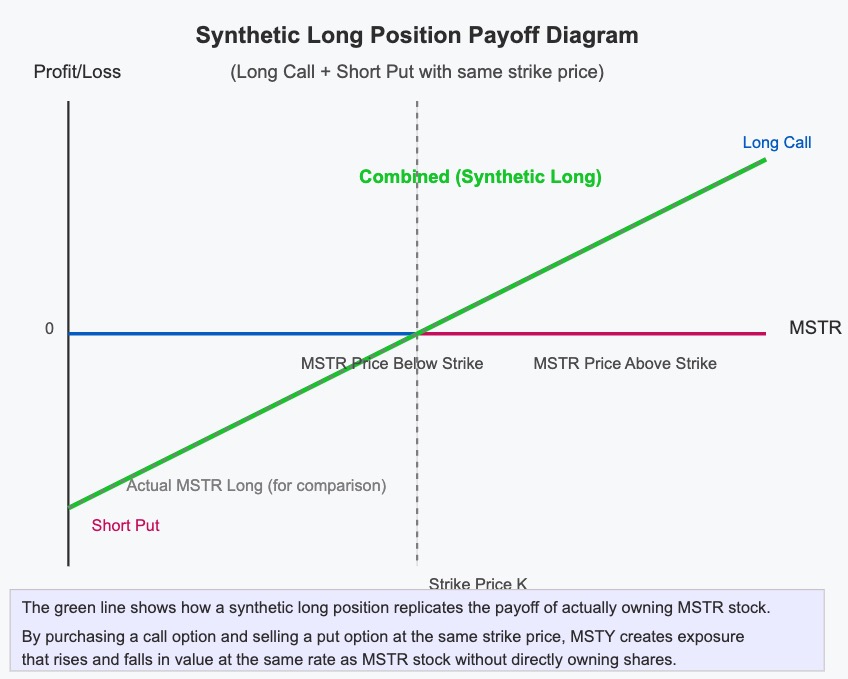
This pairing creates a position that mimics owning MSTR shares: when MSTR rises $1, the synthetic position gains approximately $1, and when MSTR falls $1, the synthetic position loses approximately $1. The fund’s holdings as of April 2, 2025, showed this synthetic long position maintained through April 17 and May 16 options with $330 strikes.
The beauty of this approach is that it requires less capital than directly purchasing MSTR shares. The fund uses the money saved to purchase Treasury securities, which serve as collateral for the options positions while generating additional interest income.
Here’s an updated version of the income generation layer section:
The Income Generation Layer
What transforms MSTY from a simple synthetic MSTR tracker into a high-yield income vehicle is the additional option strategy layered on top of this synthetic long position. The fund sells call options against its synthetic MSTR exposure to generate substantial option premium income by effectively harvesting theta decay – the natural erosion of option time value as expiration approaches.
This strategy is particularly potent with MSTR options due to their exceptionally high implied volatility (IV), which commands larger premiums. The fund capitalizes on the statistical advantage that approximately 60-70% of options expire worthless, creating a consistent income stream from expired premium. By systematically selling out-of-the-money calls on an underlying asset with heightened volatility like MSTR, the fund attempts to generate returns that some proponents describe as “pure alpha,” though this income comes with the tradeoff of capped upside potential during strong MSTR rallies.
The fund employs two different approaches to this income generation layer:
-
Standard Covered Call Strategy: Selling call options with strike prices 0-15% above the current MSTR share price, typically with expirations of one month or less. This approach maximizes income but caps upside potential.
-
Covered Call Spread Strategy: When the fund managers expect significant upside in MSTR, they may employ a spread strategy where they sell call options but also purchase calls at higher strike prices. This creates a position with defined risk that allows partial upside participation beyond the sold call’s strike price at the cost of generating less net premium.
The April 2, 2025 holdings data revealed that MSTY was employing elements of both strategies. The fund had sold various call options expiring April 4 with strike prices ranging from $320 to $355, while also holding a long position in $370 calls. This structure suggests a modified call spread approach that generates income while limiting (but not eliminating) the fund’s exposure to potential sharp upward moves in MSTR.
Portfolio Composition and Management
MSTY’s portfolio consists of three main components, each serving a specific purpose in its overall strategy:
- Options contracts (synthetic long exposure + income generation): Typically 0-50% of NAV
- U.S. Treasury securities: 50-100% of NAV, serving as collateral and providing interest income
- Cash: Maintained for operational flexibility and collateral requirements
As of April 2, 2025, the fund held approximately 66% in cash and other assets, with the remainder in Treasury securities of various maturities and options positions. This substantial cash position serves as collateral for the fund’s options activities and ensures it can meet any obligations arising from its short put positions.
Continuous Position Management
One of the most active aspects of MSTY’s management is the continuous rolling of its options positions. Since options have finite lifespans, the fund must regularly close expiring positions and open new ones to maintain uninterrupted exposure to MSTR.
For the synthetic long component, the fund rolls positions before expiration to avoid unwanted assignment. Similarly, the short call positions used for income generation are typically closed out before expiration to prevent the obligation to deliver MSTR shares (which the fund doesn’t own). This rolling activity creates high portfolio turnover and necessitates skilled execution to minimize transaction costs.
The fund managers actively select strike prices and expirations based on factors including:
- Current implied volatility in MSTR options
- Premium generation requirements to support distribution targets
- Liquidity in the options chain
- Balancing income generation against upside potential
While the fund must maintain its synthetic exposure to MSTR regardless of market conditions, managers do have discretion in how they implement the income generation strategy, particularly in choosing between the standard covered call approach and the covered call spread approach based on their assessment of market conditions.
Distribution Mechanics and NAV Dynamics
Perhaps the most discussed aspect of MSTY is its extraordinary distribution rate, which exceeds 88% annually. This eye-catching yield requires careful examination to understand its sustainability and implications for long-term investors.
Understanding the Distribution Rate vs. SEC Yield
MSTY reports two different yield figures that provide critical insight into the fund’s distribution composition:
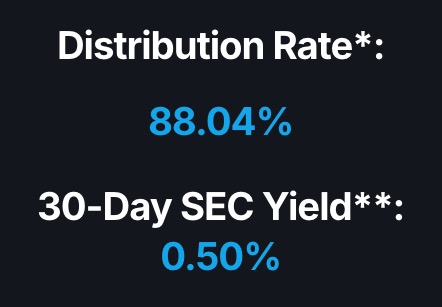
- Distribution Rate (88%+): This eye-catching figure represents the annualized payout rate based on the most recent distribution, calculated by multiplying the latest monthly distribution by 12 and dividing by the fund’s NAV. It includes all sources of cash flow: option premium income, interest from Treasury holdings, and any return of capital.
- 30-Day SEC Yield (0.5%): This dramatically lower figure represents only the “traditional” net investment income earned by the fund over the last 30 days (mainly interest from Treasuries), specifically excluding option premium income and return of capital. The SEC requires this standardized calculation to provide investors with a more conservative measure of yield.
The massive gap between these numbers (88% vs. 0.5%) confirms that most of what MSTY distributes comes from sources other than traditional investment income – primarily option premium and likely return of capital.
 *as of 2 april 2025
The NAV Erosion Concern
A key consideration for MSTY investors is the potential for NAV erosion over time.
When the fund distributes more than it generates in true income, a portion of each distribution effectively returns investors’ own capital. If these return of capital (ROC) portions aren’t reinvested, the fund’s NAV will decline over time, even if MSTR’s price remains flat.
To illustrate this dynamic, consider a simplified example:
- You invest $100 in MSTY, and the fund generates 5% monthly from its options strategy, with MSTR price staying flat
- Month 2 starting value: $100 × (1 + 5%) = $105
- 10% monthly distribution: $10.50 ($5 from options income, $5.50 from ROC)
- End value after distribution: $94.50
If you withdraw the entire distribution:
- Month 3 starting value: $94.50 × (1 + 5%) = $99.23
- 10% distribution: $9.92
- End value: $89.30
- Fund is down 10.7% with flat MSTR price, and dividends are shrinking
However, if you reinvest the ROC portion ($5.50) while keeping the true income ($5):
- Month 3 starting value: ($94.50 + $5.50) × (1 + 5%) = $105
- 10% distribution: $10.50
- End value: $94.50 (matching Month 2’s end value)
This example demonstrates why understanding the composition of MSTY’s distributions is critical. Without reinvestment of the ROC portion, both your principal and future distributions will gradually decline.
NAV Erosion in Practice: What the Distribution Data Shows
MSTY’s actual distribution data reveals the reality of its payout structure. An October 2024 distribution notice provides concrete evidence of how the fund’s payments are composed:
For the fiscal year up to October 25, 2024, of the total $20.01 per share distributed:
- 49.43% came from investment income
- 50.57% came from return of capital (ROC)
This near-even split confirms that approximately half of what investors receive represents their own capital being returned rather than new income generated by the fund’s strategy.
The practical challenge is timing: this breakdown is only provided as an estimate during the year, with final figures determined after year-end. This makes it difficult for investors to know exactly how much to reinvest to prevent NAV erosion.
What this means for investors:
- Taking all distributions in cash will likely lead to gradual NAV decline
- Preserving principal requires reinvesting roughly half of all distributions
- MSTY should be evaluated on total return rather than solely on its distribution rate
Understanding this ROC component is essential for making informed decisions about whether MSTY aligns with your investment goals and how to manage distributions to meet those objectives.
Why Funds Employ NAV Erosion Strategies
ETFs like MSTY include substantial return of capital in their distributions for several strategic reasons:
Marketing power: An 88% headline yield attracts investors more effectively than the 40-50% genuinely generated from option premiums. High distribution rates stand out in a crowded marketplace.
Stability: Option income naturally fluctuates with market conditions. Including ROC enables consistent, predictable payments that investors prefer over variable distributions.
Tax advantages: ROC distributions aren’t immediately taxable but reduce cost basis instead. This effectively defers taxation until shares are sold, potentially at lower capital gains rates.
Asset retention: Once established, reducing high distribution rates risks triggering outflows. ROC helps maintain payout levels even when option strategies underperform.
This approach isn’t deceptive when properly disclosed, but requires investor understanding of reinvestment needs to avoid unintended principal erosion. For informed investors, these distribution mechanics can be managed effectively to achieve specific income and tax objectives.
Share Price Dynamics and Volatility
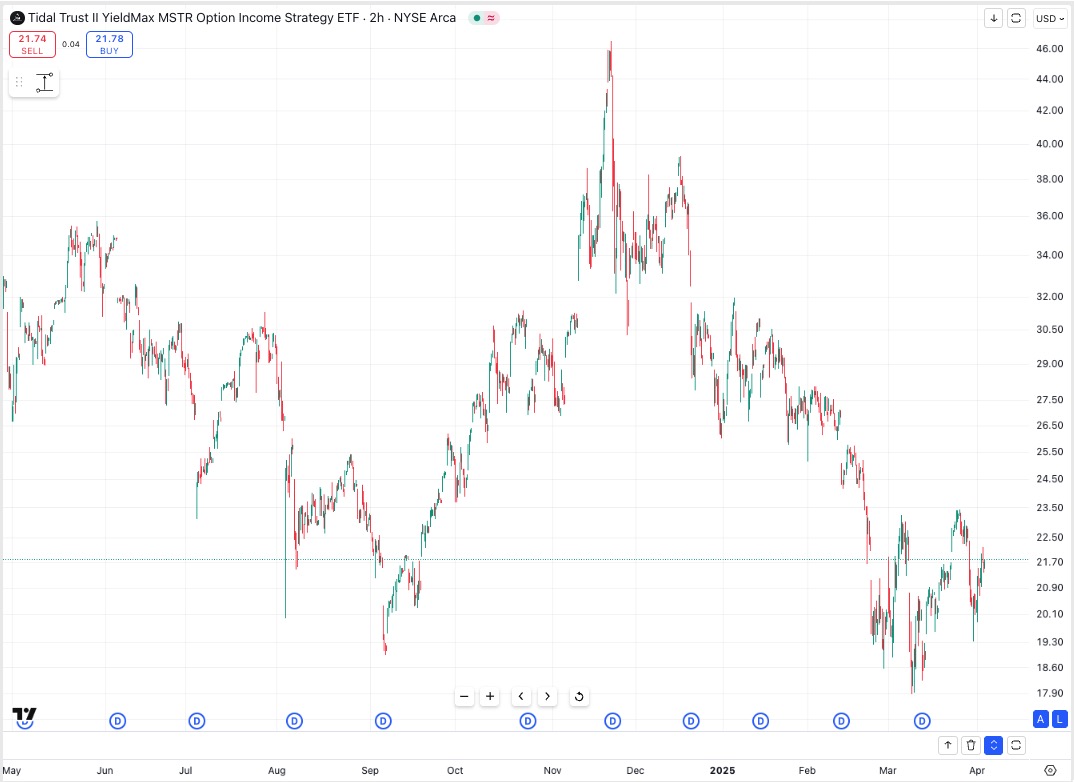
MSTY’s market price exhibits remarkable volatility that often surprises investors. From September 2024 to November 2024, the share price more than doubled from approximately $19 to $46, only to subsequently plummet back to around $18 by early 2025. This extreme price action stems from several interconnected factors that go beyond simple NAV tracking.
The Market Price vs. NAV Relationship
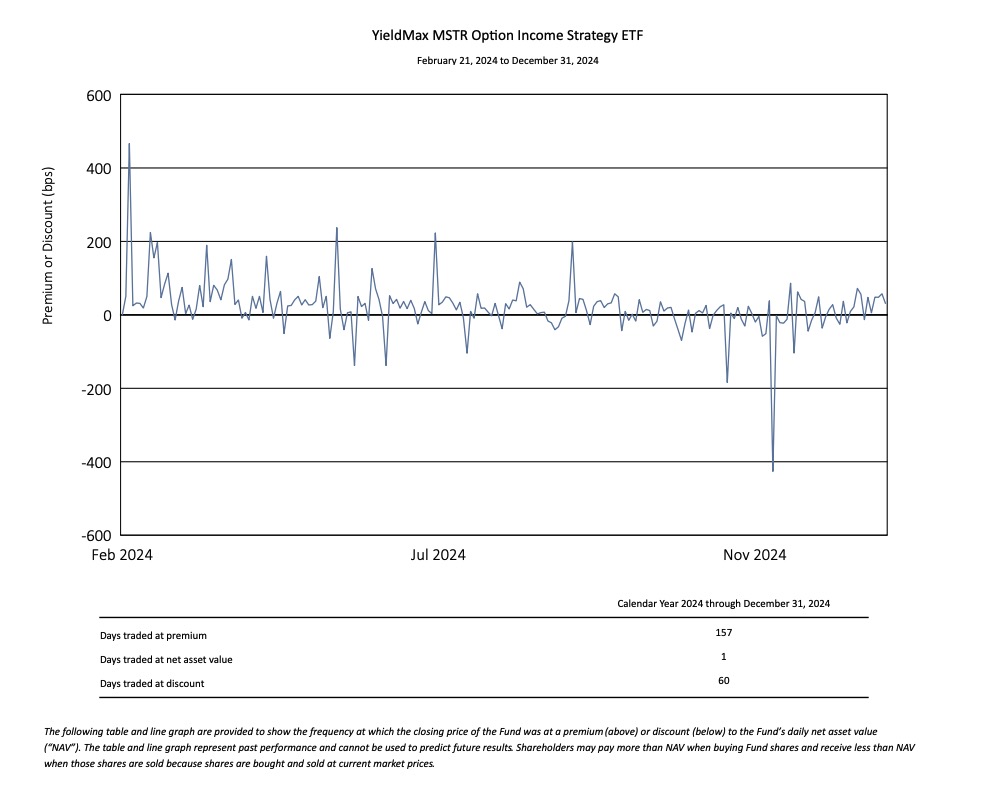
Unlike mutual funds that always trade at NAV, ETFs like MSTY can trade at prices that diverge significantly from their underlying asset value. According to trading data from February 21 to December 31, 2024, MSTY traded at a premium to NAV for 157 days and at a discount for only 60 days, with just 1 day at exactly NAV.
While professional traders and institutional investors closely monitor NAV as a fundamental anchor, several other factors drive MSTY’s share price:
-
MSTR Price Movement: The most direct driver of MSTY’s price swings is the underlying performance of MSTR stock, which itself is heavily influenced by Bitcoin’s price. When MSTR surged from September to November 2024 amid Bitcoin’s rally to new all-time highs, MSTY followed suit. Similarly, when MSTR declined, MSTY fell as well.
-
Premium/Discount Fluctuations: The gap between MSTY’s market price and its NAV isn’t static. During periods of high enthusiasm for Bitcoin or yield strategies, investors may bid MSTY to substantial premiums over NAV (sometimes exceeding 10%). When sentiment shifts negative, this premium can rapidly disappear or even turn into a discount, amplifying price swings beyond the movement in the underlying assets.
-
Yield-Chasing Behavior: The extraordinary distribution rate attracts yield-focused investors who may pay less attention to NAV fundamentals or MSTR’s price movements. When these investors enter or exit the fund en masse, it creates additional price pressure independent of NAV changes.
-
Options Market Dynamics: As an ETF employing complex options strategies, MSTY’s perceived value is influenced by changes in implied volatility in MSTR options. Higher volatility generally benefits option-selling strategies, potentially making MSTY more attractive regardless of immediate NAV impact.
-
Retail Investor Sentiment: MSTY has attracted significant retail investor interest due to its Bitcoin exposure and high yield. This investor base may trade based on broader market sentiment rather than strict NAV considerations, further disconnecting market price from underlying value.
The dramatic price action from September to November 2024 and subsequent decline illustrates how these factors can compound. As Bitcoin and MSTR rallied, MSTY’s NAV increased substantially. Simultaneously, enthusiasm for Bitcoin-adjacent investments grew, expanding MSTY’s premium to NAV. The combination produced outsized gains in the market price.
When the trend reversed, both NAV declined and the premium contracted, creating a double-negative effect that accelerated the downside move.
For investors, understanding this dynamic is crucial: MSTY’s market price reflects not just the fund’s underlying value but also market sentiment, yield expectations, and trading dynamics that can lead to extended periods of significant premium or discount to NAV. This creates both opportunities and risks beyond the already complex strategy the fund employs.
Performance Expectations Under Different Scenarios
MSTY’s performance relative to MSTR varies dramatically depending on market conditions. Because MSTY plays the covered calls and covered credit spreads strategy, these are generally considered bullish options strategies. Understanding these different scenarios helps investors set realistic expectations:
Scenario 1: Slow Rise in MSTR (very good)
When MSTR experiences a modest, steady increase, MSTY can actually outperform MSTR. The fund captures most of the price appreciation through its synthetic long position while generating additional return through option premium income. This represents an ideal scenario for MSTY investors.
Scenario 2: Steep Rally in MSTR (less good)
During periods when MSTR surges dramatically higher, MSTY will likely underperform significantly. The fund’s upside is capped by its short call positions, meaning it cannot fully participate in strong rallies. The covered call spread strategy mitigates this somewhat but still restricts participation compared to directly owning MSTR.
Scenario 3: Flat MSTR Performance (good)
When MSTR trades sideways, MSTY should outperform due to the income generated from option premiums. However, NAV erosion could still occur if distributions include significant return of capital, making reinvestment important in this scenario.
Scenario 4: Declining MSTR Price (less bad)
In bear markets for MSTR, MSTY will generally decline with MSTR but may experience slightly less severe losses due to the income cushion provided by option premiums. However, this income offset is usually minor compared to significant price declines, meaning MSTY remains highly vulnerable to MSTR downturns.
The Distribution Reality vs. Price Volatility Challenge
While MSTY’s high distribution rate often captures investors’ attention, the fund presents a more complex total return picture when examining actual distribution history alongside price volatility. This reality deserves careful consideration by potential investors.
Analyzing Real Distribution History
MSTY’s monthly distributions from April 2024 through March 2025 reveal significant variability:

The total distributions for this period amount to approximately $33.19 per share. What’s immediately apparent is the wide range in monthly payouts — from a high of $4.42 per share in November 2024 to a low of $1.38 per share in March 2025, representing more than a 3x difference between the highest and lowest payments.
This distribution volatility creates challenges for investors seeking predictable income, as the monthly payments can vary dramatically based on the fund’s options trading success and MSTR’s price behavior.
The Total Return Equation
During the same period that MSTY distributed $33.19 per share, its price experienced extreme swings. From September 2024 to November 2024, the share price surged from approximately $19 to $46, only to subsequently decline back to around $18 by early 2025.
This illustrates the double-edged nature of MSTY’s strategy:
- The high distribution rate can eventually offset significant price declines for patient investors who reinvest appropriately.
- However, the extreme price volatility means short-term investors or those requiring stable principal preservation face substantial risks.
The Reinvestment Imperative
For investors who don’t reinvest distributions, especially the return of capital portion, the picture becomes even more challenging. As previously discussed, failure to reinvest the ROC portion leads to NAV erosion over time, potentially creating a downward spiral of declining principal and shrinking distribution amounts.
This reality underscores why MSTY functions better as a tactical position within a diversified portfolio rather than as a core income holding. The fund may appeal to investors who understand both options strategies and Bitcoin market dynamics, allowing them to potentially time entries and exits more effectively. However, for investors seeking reliable income with principal preservation, MSTY’s volatility profile presents significant challenges despite its attractive headline yield.
The power of DRIP (Dividend Reinvestment Plan) becomes evident in MSTY’s price behavior after dividend payments. While the share price typically drops by approximately the distribution amount when dividends are paid, MSTY often recovers quickly due to the concentrated buying pressure from DRIP participants. With such a high distribution rate (88%+), the volume of these automatic repurchases creates substantial demand that helps the share price rebound faster than traditional dividend stocks with lower yields. This phenomenon further complicates the timing considerations for investors not using DRIP.
When evaluating MSTY (or similar high-yield, options-based ETFs), investors should always consider the total return equation — price appreciation/depreciation plus distributions — rather than focusing solely on the distribution rate itself.
Cost Basis Reduction vs income
Viewing MSTY through the lens of cost basis reduction rather than pure income generation provides maybe a more coherent framework for evaluating its value proposition. While marketed as a high-income vehicle, MSTY fundamentally functions as a mechanism to maintain exposure to Bitcoin and MSTR while systematically reducing your effective cost basis over time.
The 88% distribution rate isn’t sustainable from true income alone—it’s partly returning your capital incrementally through return of capital distributions. This structure makes mathematical sense primarily for investors with a bullish long-term outlook on MSTR and Bitcoin, who expect sufficient appreciation to offset or exceed the distributed capital.
This approach offers several strategic advantages:
-
Monetized volatility exposure: MSTY effectively converts MSTR’s extreme volatility into tangible cash distributions through option premiums, allowing investors to extract value from volatility rather than merely enduring it.
-
Psychological holding support: Regular distributions can make it easier to maintain Bitcoin exposure through its notorious volatility cycles, providing tangible returns while waiting for long-term appreciation.
-
Asymmetric return profile modification: The strategy sacrifices some upside potential in extreme bull markets in exchange for immediate cash flow, creating a modified return profile that some investors may find more palatable than direct exposure.
-
Capital efficiency: The synthetic exposure structure requires less upfront capital than direct MSTR ownership while maintaining similar price sensitivity.
For investors with strong conviction in Bitcoin’s long-term value proposition, MSTY offers a mechanism to maintain exposure while systematically extracting capital along the way. The distributions should be viewed not as sustainable yield but as partial early access to expected future gains, with the understanding that the strategy relies on substantial MSTR/Bitcoin appreciation to avoid significant NAV erosion over time.
Investor Considerations and Suitability
MSTY represents a specialized investment vehicle that isn’t appropriate for all investors. Its unique characteristics create specific considerations for potential investors:
Suitable Investor Profiles
MSTY may be appropriate for:
- Income-focused investors seeking Bitcoin-adjacent exposure
- Investors who value current income over maximum capital appreciation
- Those who understand options strategies and return of capital dynamics
- Investors bullish on MSTR and Bitcoin’s long-term potential but desiring reduced volatility
It’s less suitable for:
- Pure MSTR bulls expecting dramatic near-term appreciation
- Long-term Bitcoin holders seeking maximum upside exposure
- Tax-sensitive investors uncomfortable with return of capital distributions
- Investors seeking simplicity in their ETF holdings
Conclusion: MSTY as a Specialized Income Tool
YieldMax MSTR Option Income Strategy ETF represents a sophisticated attempt to transform volatile MSTR exposure into a high-income investment vehicle. Through its layered options strategies, MSTY offers investors a unique way to maintain exposure to the Bitcoin ecosystem via MSTR while generating substantial monthly income.
The fund’s success ultimately depends on four key factors:
- Efficient options execution and position management
- Appropriate strike selection that balances income against upside potential
- MSTR’s underlying performance trajectory
- Investor understanding of distribution mechanics and reinvestment needs
For investors who grasp its mechanics and limitations, MSTY can serve as a valuable component within a diversified portfolio, providing income from a traditionally non-income producing asset class. However, its complexity, potential NAV erosion, and capped upside make it unsuitable as a core holding for most investors.
Those considering an investment in MSTY should look beyond the eye-catching distribution rate to understand the balance of income, capital return, and price appreciation that drives its total return profile. With proper expectations and appropriate position sizing, MSTY offers a distinctive approach to harvesting income from one of the market’s most volatile Bitcoin-adjacent securities.